At the start of the second semester, I set the goal to expand my food choices and eat healthier. I wanted to move away from garlic bread and frozen pizza and as a vegetarian, I wanted to experiment with a wider variety of plant-based meals. To achieve this, I decided to try new recipes and prepare one or two meal preps each weekend, so that I could have healthy, home-cooked meals throughout the week. Over the semester, I was able to try 17 new recipes.
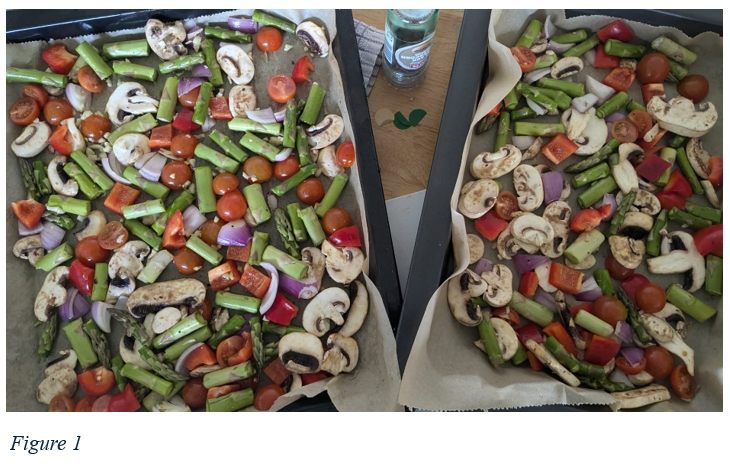
In this assignment, I will explore not only the nutritional value of the recipes but also how other factors, such as the effort to make a recipe and the price, could influence my future meal choices. By identifying trends among these factors, my goal is to improve my cooking process, making meal planning healthier and more enjoyable going forward.
Methodology
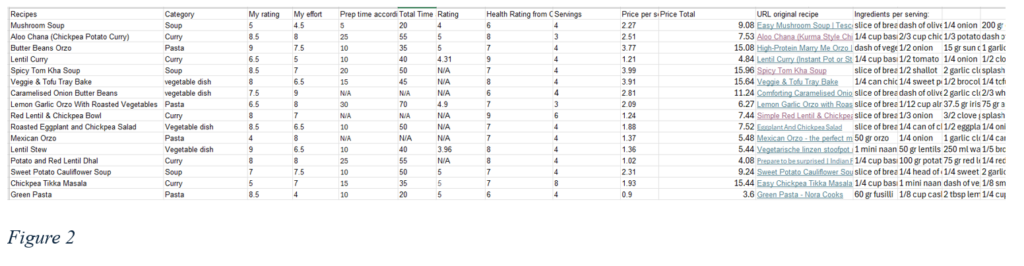
To analyse my eating habits, I collected and analysed data from the 17 new recipes I cooked. Key variables included: personal rating of how much I liked the dish (1–10), rating of the recipe from others (if available), rating of how much effort it took to make (1–10), prep and cook times given with the recipes (in min), total cost of ingredients, cost per serving, and a health score generated by ChatGPT based on the ingredient list. Additionally, recipes were categorized into four groups: soups, curries, pasta, and vegetable-based dishes. (Figure 2)
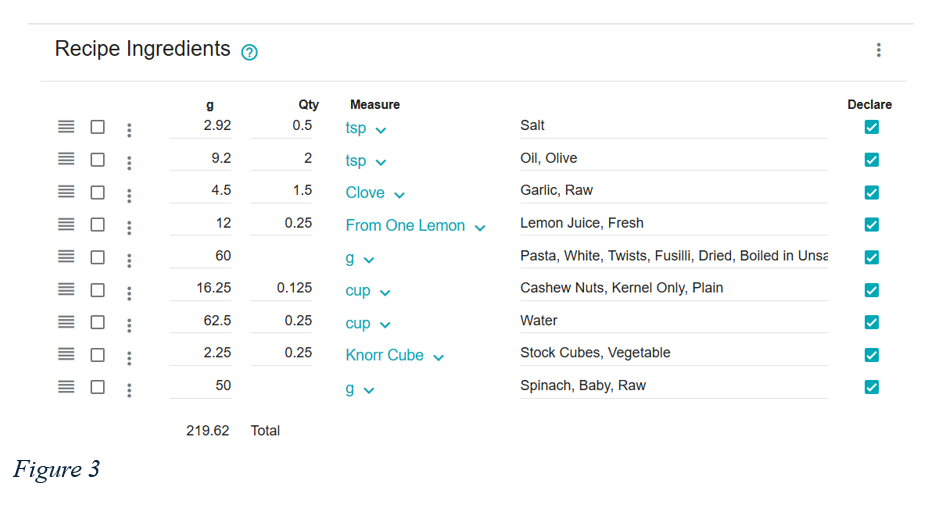
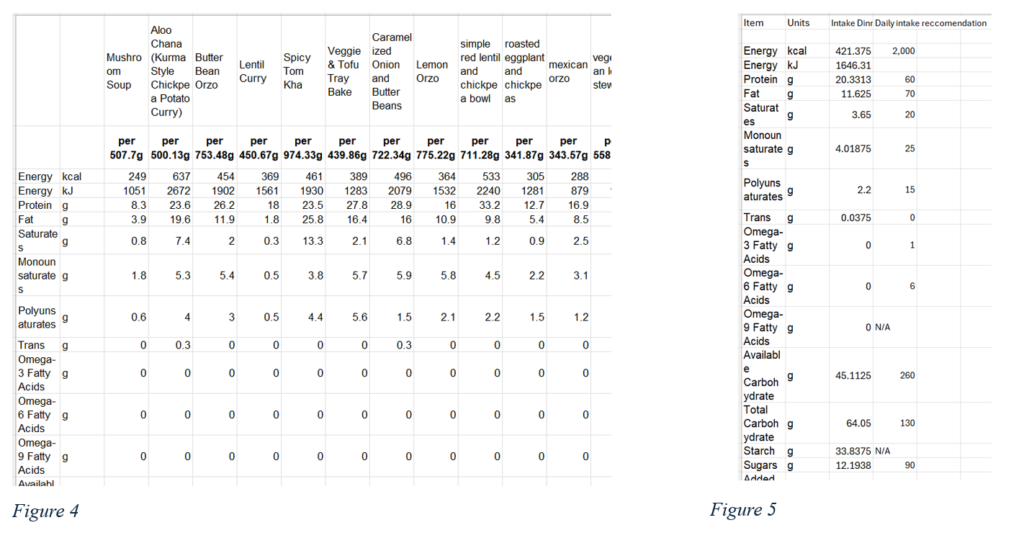
To gather more detailed nutritional information, each recipe’s ingredients were entered into NutriCalc, an online nutritional calculator (Figure 3) (NutriCalc., n.d.). This site provided the values of among other things the total calories, and macro and micronutrients of each meal. This information was logged into Excel (Figure 4), where I also created a second document with the average values from all recipes together for both the macro- and micronutrients and compared them with recommended daily intakes of the corresponding (Figure 5).
The data was then processed using Pandas in Google Collab to create visualizations and identify trends. Through this process, I aim to make data-driven decisions that might lead to more balanced, and enjoyable meals.
What Can Help Me Choose the Right Recipe?
First, I looked into how well my taste aligned with those of other people. The first scatterplot of Figure 6 shows a very weak correlation (0.16) between my personal rating of a dish and the average rating it received from others. This suggests that public ratings are not a reliable way to predict whether I will enjoy a recipe. Therefore, the rating of others may not be a useful deciding factor when choosing a recipe in the future. On the other hand, the correlation between my perceived effort and the given preparation time (0.69), as well as total cooking time (0.81), was quite strong (Figure 6.2, 6.3). The fact that total time shows a higher correlation than preparation time makes sense, as I often feel like I cannot get much else done while waiting for food to cook or roast, even if it does not require active effort. This indicates that if I want to estimate how much-perceived effort a recipe will be for me, the total time listed is the best indicator.
Figure 6
Additionally, I also wanted to explore if based on different recipe categories, I could estimate its wether I will like the taste, the effort it takes to make, the cost and healthiness. Figure 5 provides a helpful overview by breaking down the recipes into four categories (soups, curries, pasta, and vegetable-based dishes) and comparing them across these variables, including my personal rating of taste, my perceived effort, a health score from ChatGPT, and a price score. It’s important to note that the price scores were converted from the original cost per serving to a 1–10 scale so they could be visualized alongside the other categories in the same graph.
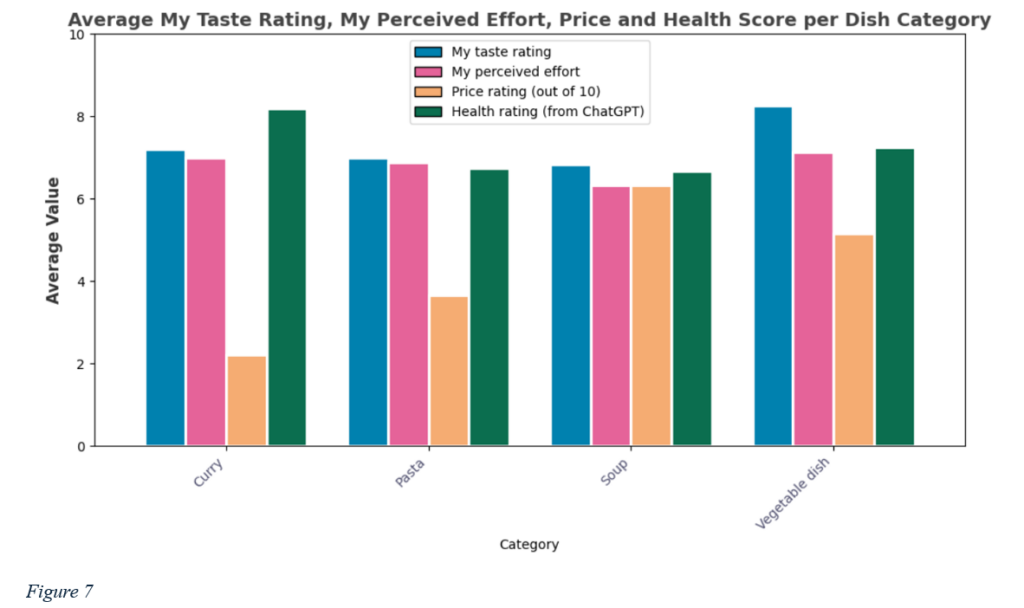
This graph, for instance, shows that curries are generally the cheapest to make, while soups tend to be the most expensive. In terms of healthiness, the differences between categories are relatively small, but curries again come out slightly ahead. When it comes to taste, vegetable-based dishes received the highest average ratings from me, although they also required the most effort to prepare. Pasta dishes score quite average on all values, indicating that they are a reliable, balanced option when I am not prioritizing any one factor. This bar graph can help to decide what kind of recipe to search for based on my priorities at the time, whether that is cost, health, taste, or effort.
How Can I Improve the Nutritional Quality of My Meals?
When looking at the nutritional information, it’s important to remember that this analysis only shows one meal of the day. Even though dinner is probably one of the most nutritious meals for me, it does not need to provide the full range of vitamins and minerals on its own. Since my average dinner contains 421 calories, and the recommended daily intake for females is around 2000 calories, the goal is for dinner to supply about a quarter of my daily nutrition.
Micronutrients
Looking at my nutrition (Figure 8) compared to the recommended daily intake (Health Council of the Netherlands, 2018), certain deficiencies commonly associated with vegetarian diets also appear in mine, specifically, Vitamin D, Vitamin B12, and Iodine. These nutrients are harder to get from plant-based sources, so it is not surprising that they came up low. To improve in these areas, I could consider incorporating fortified foods more often, such as fortified plant milk (like soy or oat milk) which often contain both vitamin D and B12. Also, seaweed could be a simple way to boost iodine intake. (Gibbs, 2024)
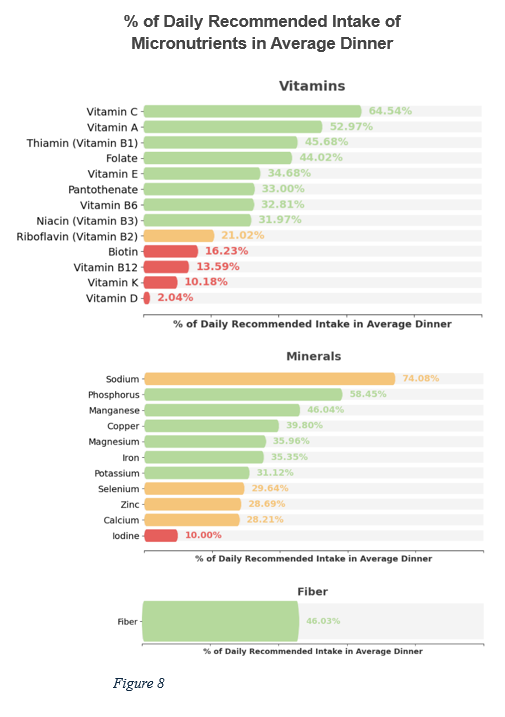
The nutrients selenium and calcium, also nutrients that are commonly low in vegetarian diets, should be watched as they are only just adequate in my current meal plan. Adding Brazil nuts occasionally can help increase selenium levels, as just one or two nuts can meet the daily requirement. For calcium, leafy greens like spinach or kale could be helpful additions. (Gibbs, 2024) Biotin, vitamin K, and zinc were also on the lower end, and these could be supported through foods like eggs and seeds. Interestingly, iron, a common concern for vegetarians, does not appear to be a problem at dinner, which might be thanks to ingredients like lentils, or beans which were often used.
While it is important to address deficiencies, it is also necessary to keep an eye on excessive intake. Sodium intake might be too high since the maximum recommended intake for sodium is only about twice the recommended daily amount. Therefore, it might be worth reducing the amount of added salt in recipes.
Finally, my fibre intake looks good, with dinner alone covering about half of my daily recommended intake. This is a good sign, especially since fibre plays such a key role in digestion and long-term health.
Macronutrients
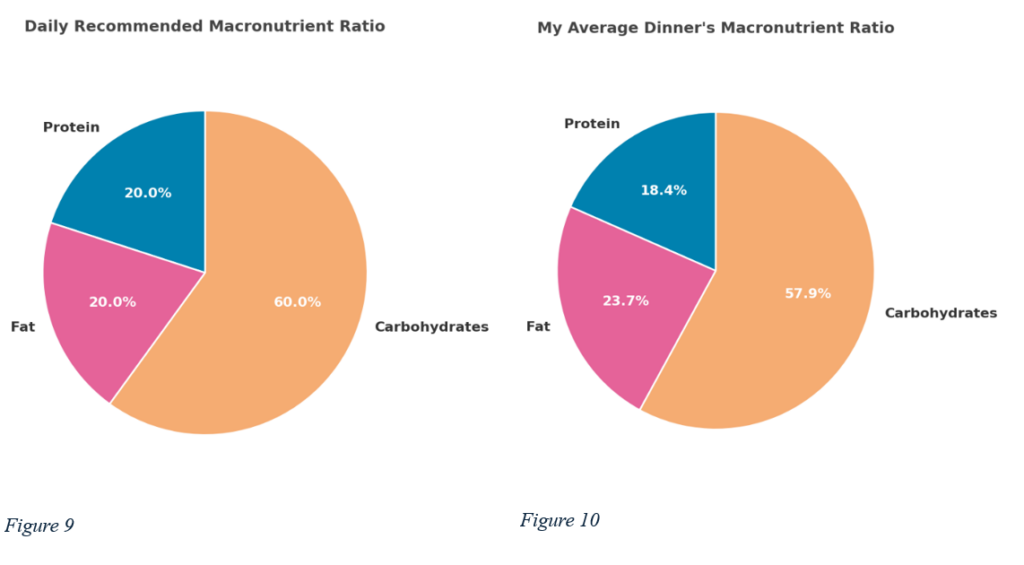
In terms of macronutrients, my dinners consisted of 57.9% carbohydrates, 23.7% fat, and 18.4% protein. This is very close to the general recommendations (Venn B, 2020), which suggest around 60% carbs, 20% fat, and 20% protein. However, since my protein intake is just below the suggested amount and my fat intake is a bit higher, I may want to focus on increasing protein slightly. Given that dinner might be my main source of protein during the day, adding more legumes, lentils, tofu, or high-protein grains like quinoa could be good.
Improvements
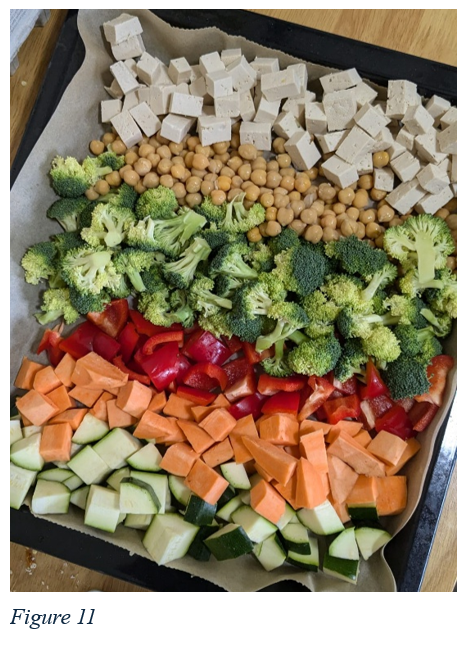
If I were to do this project all over again, there are a few things I would approach differently to make the process more efficient and the insights more meaningful. First, I would consider tracking all meals for a few days, to gain a fuller picture of my daily nutrition and see whether any deficiencies are consistent throughout the day or isolated to one meal. Also, for future analysis, it would be helpful to keep track of how much time each recipe takes from start to finish to better compare it to the provided prep and cooking time. This would give a more realistic sense of time management and help better plan meal prep sessions. In addition, I would take photos of the finished dishes to add a visual layer to the project. Finally, increasing the sample size or tracking recipes over a longer period would make any patterns more reliable and informative than they are now.
Conclusion
Through this analysis, I gained several key insights that will help me make better meal choices in the future. By examining taste, effort, cost, and nutrition across different categories, I identified patterns that can guide my decisions going forward. I also learned that public ratings are not a reliable predictor of whether I’ll enjoy a recipe, while total cooking time is a stronger indicator of the perceived effort required. Nutritionally, I recognized areas for improvement, particularly in micronutrients like Vitamin D, B12, and iodine. While my macronutrient breakdown is close to recommendations, increasing my protein intake would make it even better. Overall, this analysis has shown me how to better balance convenience, cost, health, and taste in meal planning, and has provided clear steps to improve my nutrition moving forward.
Sources
- Gibbs, J.; Cappuccio, F.P. (2024) CommonNutritional Shortcomings in Vegetarians and Vegans. Dietetics, 3, 114–128. https://doi.org/10.3390/ dietetics3020010
- Health Council of the Netherlands. (2018). Dietary reference values for vitamins and minerals for adults (No. 2018/19e). The Hague: Health Council of the Netherlands. https://www.healthcouncil.nl/documents/advisory-reports/2018/09/18/dietary-reference-values-for-vitamins-and-minerals-for-adults
- NutriCalc. (n.d.). Recipe nutrition analysis. Retrieved April 23, 2025, from https://app.nutricalc.co.uk/recipe/1434212
- Venn B. J. (2020). Macronutrients and Human Health for the 21st Century. Nutrients, 12(8), 2363. https://doi.org/10.3390/nu12082363