1. Introduction
With the original TFI Leap Top-Up application (National Transport Authority, 2016) users faced issues including NFC scanner difficulties, limited payment options, and slow balance updates. However users appreciated its simple layout. The new prototype addresses these key concerns while keeping elements that users like.
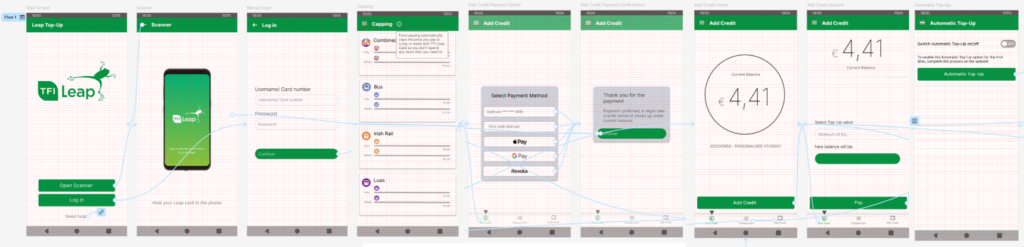
To improve the login process, the prototype offers a manual login option alongside the NFC scanner. Payment options have been expanded to also include Google Pay, Apple Pay, and Revolut. To address users’ concerns about slow balance updates, a message now informs users that updates may take time after payment.
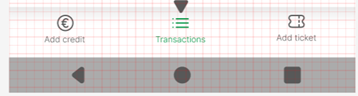
The unclear and underutilized “capping” page has been moved to the side menu with a pop-up explanation about the page. This simplifies the bottom menu to focus on ‘add credit’, ‘transactions’, and ‘add ticket’. The ‘add credit’ page has been redesigned into two pages: the first displays the current balance, and the second allows users to select a top-up amount and complete the payment.
The new prototype aims to resolve users main frustrations and improve usability, while maintaining the app’s simplicity, delivering an improved user experience. (Appendices A,B)
2. Role in the Redesign
In the redesign process, my primary role was Developer, and my secondary role Manager. As manager, I ensured good communication within the team and towards the module instructor. I also created an overview of the tasks, and set realistic deadlines together with team members.
Early on, we worked as a team to organize all data in Miro, others worked on the personas, scenarios, and HTA, while I helped define the Optional Requirements with the Data Analyst. At the end, I also prepared the content for the presentation slides. (Appendices C-G)
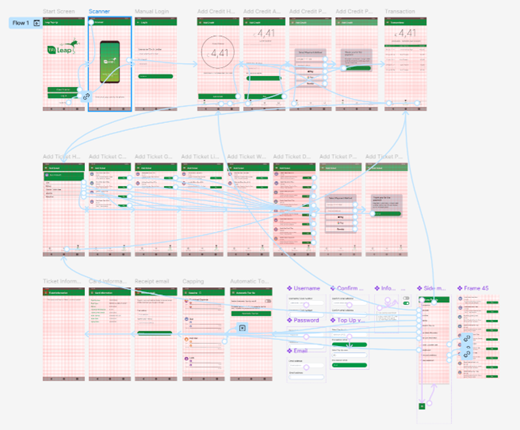
As the Developer, I created the final TFI Leap Top-Up prototype using Figma (Appendices A-B), based on the clear plan for the prototype visuals and functionality from the UI and Interaction Designer (Appendices H-J). First, I had to familiarize myself with Figma’s key functionalities, including building frames, designing interactions between them, and developing a layout. Once the basic structure was complete, I implemented advanced features, including a pop-up side menu, toggle buttons, input text fields, external links to websites and emails, pop-up notifications, and scrolling functionality. These features added interactivity and realism to the prototype, allowing users to visualize how the redesigned app would function. Overall, my contributions ensured the final prototype was functional and user-centred.
3. User Study
3.2. Procedure
The user study took place in locations suitable for individual interviews, with one on the street and four in a closed room. Participants consented to anonymous data collection and recording. They explored the new prototype by attempting to top-up and understand the pages on the bottom and side menus. Afterwards, they completed a Microsoft Forms questionnaire for quantitative data, followed by a semi-structured interview for qualitative insights. (Appendices K-X)
3.2. Apparatus
During the interview, participants had access to both the prototype and the TFI Leap Top-Up App with a Leap Card. The study used Microsoft Forms to collect demographic data and responses to NASA-TLX (Hart, 2006), UEQ-S (Schrepp, 2017), and PSSUQ (Lewis, 1992) for quantitative insights. Participants completed the questionnaire on their own or provided devices. The interview was recorded on a mobile phone, and the quantitative data was analyzed using Excel.
3.3. Participants
Five users participated in the study, with each interview lasting approximately 10 minutes (see Table 1). All of the participants were female, and the group was relatively young and academically focused, with four participants under 21 years old and currently studying. All participants were familiar with mobile devices, having used smartphones for more than 5 years, and spending a minimum of one hour on their devices daily.
| User 1 | User 2 | User 3 | User 4 | User 5 | Average | |
| Quantitative data | 01:27 | 07:02 | 06:27 | 01:57 | 01:53 | 03:45 |
| Qualitative data | 03:59 | 05:10 | 09:45 | 08:20 | 06:21 | 06:43 |
| Total time | 05:26 | 12:12 | 16:13 | 10:17 | 08:14 | 10:28 |
| Table 1 |
4. Results in Comparison with Previous Study
4.1. Quantitative Data
4.1.1.UEQ-S
User experience improved significantly from 0.8 for the original application to 1.33 for the prototype. Pragmatic quality rose to 2.1, and hedonic quality to 0.55, each improving by 0.5 points. This reflects higher user satisfaction with the new interface, and enhanced pragmatic functions, such as clarity and efficiency.
| Dimension | Original | Prototype |
| Pragmatic quality | 1.55 | 2.1 |
| Hedonic quality | 0.05 | 0.55 |
| Overall score | 0.8 | 1.33 |
| Table 2 |
4.1.2.NASA-TLX
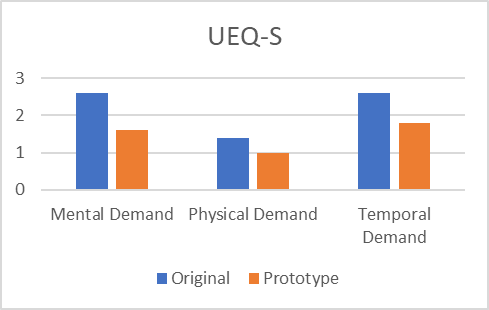
All dimensions have significantly better results compared to the original application, with the overall workload (1.6) increasing by a whole point. The effort (2), and frustration levels (1.4) are noticeable, improving over one point each. This indicates that the prototype reduced the app’s initial somewhat high demand and frustrations effectively.
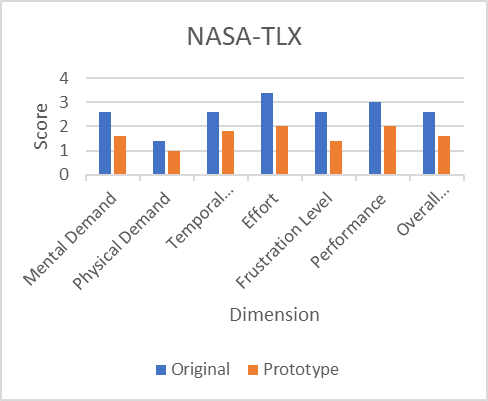
| Dimension | Original | zPrototype |
| Mental Demand | 2.6 | 1.6 |
| Physical Demand | 1.4 | 1 |
| Temporal Demand | 2.6 | 1.8 |
| Effort | 3.4 | 2 |
| Frustration Level | 2.6 | 1.4 |
| Performance | 3 | 2 |
| Overall Workload | 2.6 | 1.6 |
| Table 3 |
4.1.3.PSSUQ
Overall user satisfaction (1.7) increased significantly for the prototype. Most notably, information quality improved from 3.04 to 1.9, showing that the prototype effectively addresses clarity issues present in the original version. Additionally, interface quality and system usefulness have both improved, suggesting the prototype has resolved issues in these areas successfully.
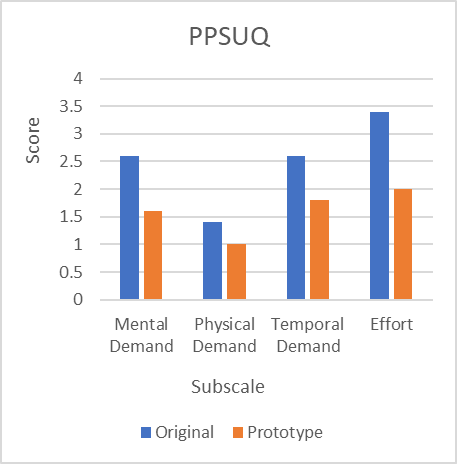
| Subscale | Original | Prototype |
| System Usefulness | 2.17 | 1.6 |
| Information Quality | 3.04 | 1.9 |
| Interface Quality | 2.60 | 1.47 |
| Overall PSSUQ Score | 2.59 | 1.7 |
| Table 4 |
5. Qualitative Data
5.1.1.Usability
The original application, described as ‘easy,’ improved further in the prototype, with users calling it ‘more useful’ and ‘well designed.’ Users initially desired more payment options, and were satisfied with the added options. However, one noted being restricted to a €5 top-up. Dependability items are further addressed in Cognitive Load. Visuals, originally described as ‘clean’ and ‘easy’, received continued positive feedback. Users appreciated the ‘minimalistic’, ‘clean’ design and the green theme, which felt environmentally friendly. A user did suggest adding a dark mode.
5.1.2.Cognitive Load
Users continued to describe the app as “easy” and “straightforward”. Most users appreciated the option to login manually, which resolved issues users had with scanning their Leap Card. Random downtime, and slow balance updates, were not mentioned as problems in the new evaluation. New dependability issues included slow app loading and difficulty clicking some of the icons. The suggestion to include an automatic top-up in the original survey was perceived positively. For future improvements, a user suggested adding push notifications.
5.1.3.User Satisfaction
Users continued to find the application ‘easy’ to navigate. The addition of an information icon improved the overall understanding of the ‘capping’ page. New concerns included a ‘busy side menu’ and difficulty finding the automatic top-up. Moving the ‘capping’ page to the side menu was generally accepted, with one user appreciating the simplified bottom menu, though another felt this change could be confusing. Feedback on the changed ‘add credit’ flow was mixed. Suggestions to incorporate the TFI Live application remained, while no users missed the initially requested search function.
6. Discussion
6.1. Usability
The growth in pragmatic quality (2.1), reflects user feedback stating that the application is ‘more useful’. Users were especially satisfied with the added payment options. Difficulties typing a payment amount can be attributed to Figma limitations; this issue will not persist in the final product. Other dependability points are discussed in Cognitive Load. The previous hedonic score 0.05 improved to 0.55, with users appreciating the minimalist design and environmentally friendly feel. Unlike before, users were less bothered by the application’s lack of excitement, resulting in a higher hedonic score. Adding a dark mode, as suggested, could further improve the hedonic quality.
6.2. Cognitive Load
The overall workload improved, with significant improvements in effort and frustration level. This is mainly due to resolved difficulties, including a manual login option to work around scanning issues, the automatic top-up, and more payment options. There was also no mention of previously mentioned random downtime, or slow balance updates, possibly because of our added notification after payment. However, new issues included a long loading time, and difficulty clicking icons. Increasing the responsive touch area for icons should address this in future versions. A design implementation to further reduce the overall workload is to add push notifications for low balances.
6.3. User Satisfaction
The overall increase in user satisfaction can largely be attributed to better information quality, which increased as a result of an available explanation for the ‘capping’ page, and a message about slow balance updates after payment. However, users did note a ‘busy’ side menu and difficulty finding the automatic top-up. Future iterations could organize the side menu into sections with titles for clarity. Improved inter-face scores suggest the improvements were well received, reflected by users appreciating the simplified bottom menu. System usefulness also improved, but could further benefit from addressing the repeated request to incorporate the TFI Live application.
7. Conclusion
The close collaboration within our group was essential to design a functional prototype based on user feedback. Based on the insights organized by the Data Analyst, the Interaction Designer created workflows, while the UI Designer developed layout sketches. Finally, I, as the Developer, used these designs to create the final prototype in Figma. Open communication and regular meetings ensured we fully understood each other’s perspectives, proposals, and feedback.
The user study for this prototype showed improvements in usability, cognitive load, and user satisfaction. Key changes include resolving Leap Card scanning issues with a manual login option, adding payment methods, and improving information clarity with pop-ups and explanations. Features such as automatic top-up, a simplified bottom menu, and a reconstructed ‘add credit’ page also contributed to improved scores.
For future iterations, the application could benefit from a dark mode, push notifications for low balances, a better-structured side menu with titled sections, and the incorporation of TFI Live into the application. Additionally, the responsive touch area for icons should be increased. Also, text input should be enabled, for example for top-up amounts, which is not possible in Figma. These adaptations would further improve the user experience with the TFI Leap Top-Up application.
8. References
- Hart, G. S. (2006) NASA-TASK LOAD INDEX (NASA_TLX); 20 YEARS LATER. Moffett Field, CA. NASA-Ames Research Center. Accessed: 26/11//2024
- Lewis, J. R. (1992) PSYCHOMETRIC EVALUATION OF THE POST-STUDY SYSTEM USABILITY QUESTIONNAIRE: THE PSSUQ. Boca Raton, FL. IBM Design Center. Accessed: 26/11/2024.
- National Transport Authority (24 January 2016) Leap Top-Up (Version 0.4.2) [Mobile App]. Available at: https://play.google.com/store/apps/details?id=ie.leapcard.tnfc. Accessed: 26/11//2024.
- Schrepp, M. et all. (11 September 2017) Design and Evaluation of a Short Version of the User Experience Questionnaire (UEQ-S). SAP AG. UNIR. Accessed: 16/11/2024
9. Appendices
9.1. Appendix A; Figma Prototype
https://www.figma.com/proto/5XyVblwMSQOes4cc9M6bgi/TFI-Leap-Top-UP?node-id=0-1&t=IFUvL8SYrlOvxEWj-1
9.2. Appendix B; Figma Prototype Workspace
https://www.figma.com/design/5XyVblwMSQOes4cc9M6bgi/TFI-Leap-Top-UP?node-id=0-1&t=tZBGWYIzLRXcPNij-1
9.3. Appendix C; Miro Workspace
https://miro.com/app/board/uXjVLFGKhHo=/?share_link_id=301860895743
9.4. Appendix D; Personas and Scenarios
https://docs.google.com/document/d/1rzPvJnoSw_Tlk-KJI1ZXrOnA5chqeiNCOLpaF8gWzec/edit?usp=sharing
9.5. Appendix E; Hierarchical Text Analysis
https://docs.google.com/document/d/1BAV72j4YjW1f0UwnRB-zP39Ovi_n6MUK8HBou6OS8Rs/edit?usp=sharing
9.6. Appendix F; Optional Requirements and MoSCoW analysis
https://docs.google.com/document/d/1rOcCRLkFrLLphMfxlDs7hFQXUmry8uymY2s7TQ6OT2k/edit?usp=sharing
9.7. Appendix G; Presentation
9.8. Appendix H; Data Analysis
https://docs.google.com/document/d/1ZmMHTc9lRxULbcvqtX18Y_jA8EccdQlmiCely4oPkUM/edit?usp=sharing
9.9. Appendix I; User Flow Chart
https://xmind.ai/share/SjiD6B0o
9.10. Appendix J; UI Design
https://docs.google.com/document/d/102nZskvhHCOwAZKL31RyTNMhi0bSh2VCH7S3AZddxlI/edit?usp=sharing
9.11. Appendix K; Microsoft Forms Questionnaire Original
9.12. Appendix L; Microsoft Forms Questionnaire Prototype
9.13. Appendix M; Qualitative Questions Original
9.14. Appendix N; Qualitative Questions Prototype
https://docs.google.com/document/d/1tnZCNOVzz0QParGyOaXOpvVizMf5Wy_WOL52_4JDiFw/edit?usp=sharing
9.15. Appendix O; Qualitative Interview Summary Original
9.16. Appendix P; Qualitative Interview Summary Prototype
https://docs.google.com/document/d/1uwdHL_uLtFhO7rAYwH50nIMxqQQ5j2iGj33m6VipyKA/edit?usp=sharing
9.17. Appendix Q; Raw Quantitative Data Original
9.18. Appendix R; Raw Quantitative Data Prototype
https://docs.google.com/spreadsheets/d/1Tj2JUH4GnIcLUhwpqIlieYV1NXh3uHiFSojkDbW7oMA/edit?usp=sharing
9.19. Appendix S; Quantitative Data Ready for Analysis Original
9.20. Appendix T; Quantitative Data Ready for Analysis Prototype
https://docs.google.com/spreadsheets/d/1avnqRkkymGnb5KbCRpQClbyFw_idwM08acw4Osp4efM/edit?usp=sharing
9.21. Appendix U; Quantitative Data Tables Original
9.22. Appendix V; Quantitative Data Tables Prototype
https://docs.google.com/document/d/1xZY-DVy50aiHgzVxpfnEuspbkWT3Er0iUhhYDG-PD54/edit?usp=sharing
9.23. Appendix W; Qualitative Data Analysis Original
9.24. Appendix X; Qualitative Data Analysis Prototype
https://docs.google.com/document/d/16gB72pjjELCj32jG3ZhJ1YLvc4gXfmIVP6uTq2uDTsI/edit?usp=sharing